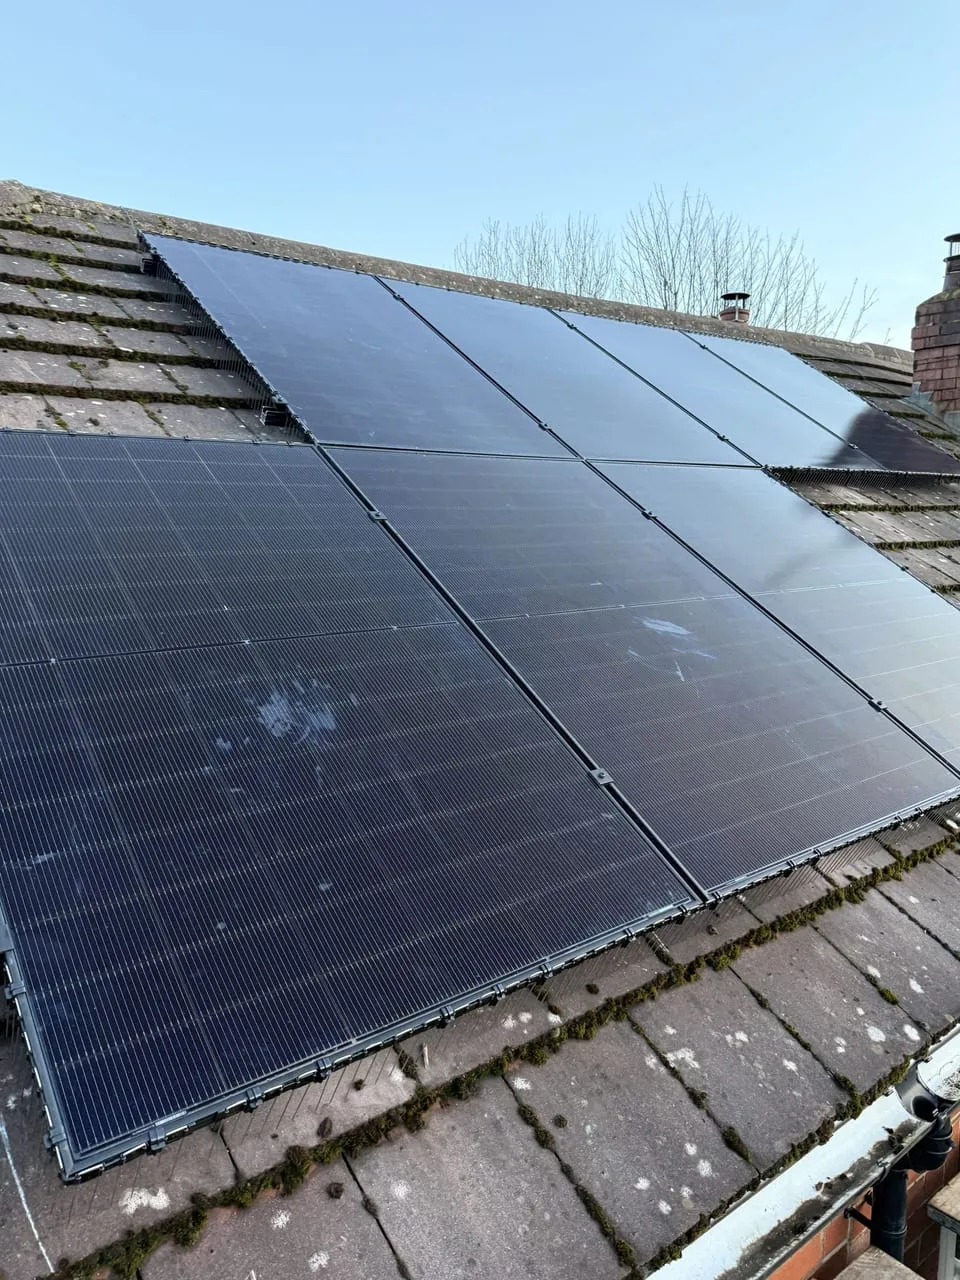
If your solar panels have been sitting in bright sunshine and your generation figures still look flat, it’s natural to worry something’s broken. The good news: most “underperformance” complaints turn out to be either normal seasonal variation, a simple app-reading misunderstanding, or a small fixable fault — a tripped isolator, a shaded panel, or one dud string. Genuine equipment failure is comparatively rare. This is the 10-minute check most homeowners can run themselves before picking up the phone.
Start with what “normal” actually looks like
The single biggest cause of false alarms is comparing your system to the wrong benchmark. UK solar yield is highly seasonal and location-dependent, and a system generating “only” 8 kWh on a grey November day isn’t faulty — it’s doing exactly what physics allows.
As a rule of thumb, well-sited UK systems produce around 850 kWh per kWp per year on average, rising to 1,000–1,050+ kWh/kWp in the sunniest parts of the south coast, and dropping somewhat in the north or on poorly oriented roofs. Spread across the year, that annual figure is very unevenly distributed — a 4kW system might produce 15–20 kWh on a clear June day and barely 2–3 kWh on a dull December one.
| System size | Typical annual yield (UK average, ~850 kWh/kWp) | Summer daily (clear day) | Winter daily (overcast) |
|---|---|---|---|
| 3 kWp | ~2,550 kWh | 10–13 kWh | 1–2 kWh |
| 4 kWp | ~3,400 kWh | 14–18 kWh | 2–3 kWh |
| 6 kWp | ~5,100 kWh | 20–26 kWh | 3–4 kWh |
| 10 kWp | ~8,500 kWh | 34–42 kWh | 5–7 kWh |
Use these as sanity checks, not gospel — your own figure depends on roof pitch, orientation (south is best; east/west typically costs 15–20% versus true south), shading, and panel age. If you want a proper baseline for your postcode and roof before you compare, a good solar panel calculator will model expected output far more precisely than a rule of thumb, and it’s worth doing this once when the system is new so you have your own reference point rather than a generic average.
It’s also worth remembering that modern panels degrade very slowly. Good-quality N-type panels (TOPCon, HJT or IBC/ABC cell types, now common on newer installs) typically lose only around 0.4% of output per year and are rated to last 25–30+ years. A five-year-old system should still be producing roughly 98% of its original output — degradation is not a plausible explanation for a sudden drop. If your generation has fallen off a cliff rather than gently declined, that points to a fault, not ageing.
The 10-minute self-check
Work through these in order — most genuine issues get caught in the first three steps.
1. Check the app against a clear-sky day, not just “today”. Open your inverter manufacturer’s monitoring app (SolarEdge, Enphase, GivEnergy, Solis, Growatt, etc. — whichever came with your install) and look at the daily generation graph, not just the running total. A healthy day should produce a smooth bell curve rising from sunrise, peaking around midday, and tapering to sunset. A flat line, a sudden cliff-edge drop mid-afternoon, or a jagged sawtooth pattern all point to a specific fault rather than weather.
2. Look for a missing panel or string in the per-panel view. If you have panel-level optimisers or microinverters (SolarEdge, Enphase), the app will show output per panel. One panel reading zero while its neighbours are fine usually means a loose MC4 connector, a failed optimiser, or shading (a chimney, aerial, or overhanging branch moving with the seasons). If you only have string-level data and one string is dead while the other is normal, that halves your immediate suspect list.
3. Check the date and weather retrospectively. Cross-reference the low-output day against what the weather actually did — heavy cloud, fog, or an unusually short winter day easily explains a 70-80% drop versus a clear-sky equivalent. Met Office or a weather history app is enough for this.
4. Check for an inverter fault code or offline status. Inverters display fault codes on their own screen or flag “isolation fault”, “grid fault”, or “offline” in the app. An “offline” or “no communication” status often just means a Wi-Fi dropout at the inverter, not a generation problem — but a persistent fault code needs investigating.
5. Physically inspect the isolators and breakers — but only if you’re comfortable and it’s safe to do so. Solar installs have at least two isolator switches: a DC isolator (usually near the inverter or on the roof) and an AC isolator (near the consumer unit), plus a dedicated breaker in your fuse board. After storms, power cuts, or building work, these can trip or get knocked. If a switch has visibly flipped to “off”, and you’re confident it’s safe to do so, you can switch it back on. If it trips again immediately, stop — that’s a fault, not something to keep resetting.
6. Check for physical shading or soiling. New extensions, a neighbour’s tree that’s grown, scaffolding left up after other work, or a thick layer of pollen, moss, or bird mess can all cut output meaningfully. Even partial shading on one corner of one panel can drag down an entire string’s output on older string-inverter systems, because the whole string runs at the speed of its weakest panel.
7. Check your export/import figures against your smart meter, not just the inverter. Occasionally the inverter is reporting generation correctly but the story you’re comparing it to (a bill, a Smart Export Guarantee statement) uses a different metering point or a different date range. SEG export rates also vary a lot by supplier — commonly somewhere in the 12-20p/kWh range at the better end — so a “lower payment” isn’t always a generation problem; it might be a lower export tariff or more of your generation being self-consumed (which is actually good news for your import bill).
Common causes, ranked by how often they turn out to be the answer
- Seasonal variation — by far the most common “problem” reported, and not a problem at all.
- New shading — trees, extensions, or scaffolding that weren’t there at commissioning.
- A single failed optimiser or microinverter — a genuine component fault, but usually cheap and quick to swap under warranty.
- A tripped isolator after a storm or power cut — a two-minute fix if you’re comfortable checking it safely.
- Inverter firmware/communication glitch — often resolves with a manual reboot (isolate, wait, restore) but should still be logged.
- A full string failure or blown fuse — less common, needs a qualified engineer.
- Panel degradation — genuinely rare as a cause of noticeable, sudden drops given modern panels’ ~0.4%/year rate.
When to stop self-diagnosing and call someone
Call a qualified engineer if any of the following apply:
- The inverter shows a persistent fault code that doesn’t clear after a safe reboot.
- Output has dropped sharply and stayed down for more than a week with no obvious weather or shading explanation.
- You can see physical damage — cracked panels, scorch marks, a burning smell, or a tripped breaker that won’t reset or trips again immediately.
- Your system is still within its installer’s or manufacturer’s warranty — get it looked at before doing anything that could complicate a warranty claim.
- You’re simply not comfortable working near the isolators or on the roof. There’s no reason to take a risk here.
For homeowners anywhere in the UK who want an independent read on genuine underperformance — rather than a sales pitch for a new system — solarmaintenancesolutions.com specialises specifically in solar and battery operations and maintenance, including diagnosing exactly this kind of fault without trying to upsell you a full replacement. That’s a useful distinction: a maintenance specialist’s incentive is to fix the actual problem, not to sell you a bigger system.
If the diagnosis points to a local wiring, isolator, or consumer-unit issue rather than a panel or inverter fault, it’s worth using an electrician who already knows renewables rather than a general sparky. In Doncaster and South Yorkshire, ElectriFusion Solutions covers both solar and general electrical work, which is handy when a fault turns out to be on the electrical side rather than the solar side. In West Kent, Hazell Electrical offers the same combined electrical-plus-renewables cover for exactly this kind of borderline fault.
If your original installer has gone out of business (unfortunately common after a decade of boom-and-bust in the industry) or you’ve moved into a house with an inherited system nobody explained to you, getting a fresh MCS-certified engineer to survey it is worthwhile — partly for peace of mind, and partly because MCS certification is what keeps your Smart Export Guarantee eligibility intact if you ever switch export tariffs. Ecoaim in Livingston services solar and battery systems across Central Scotland, and Greenlinc Renewables covers Lincolnshire — both worth a call if you’re in those regions and inherited a system you don’t fully understand.
A note on VAT and timing if a repair becomes a replacement
If your self-check (or an engineer’s visit) concludes the fault is terminal rather than fixable — say, an inverter beyond economic repair after 12-15 years of service — it’s worth knowing that residential solar and battery storage currently sit at 0% VAT in Great Britain, scheduled to run until 31 March 2027 before reverting to 5%. That applies to battery storage retrofits too, so if you’re weighing up adding storage while an engineer is already on your roof, now is a genuinely cheaper moment to do it than it will be from April 2027. For a wider read on why 2025 was a record year for UK solar (257,397 installations, +32% year-on-year, and installed capacity now covering roughly 6.4% of UK electricity), the trade-focused analysis on solarweekly.co.uk is a useful companion piece, and if a new inverter or extra panels are genuinely on the cards, our cost of solar panels guide sets out current 2026 pricing so you know roughly what a fair quote looks like.
The takeaway
Ninety percent of “my solar isn’t generating” worries are solved by checking the weather, checking the season, and glancing at the per-panel or per-string breakdown in your app rather than the headline number. Work through the isolators and breakers only if you’re confident doing so safely, and treat a persistent fault code or a sudden, unexplained, sustained drop as your cue to call a specialist rather than keep troubleshooting alone. Most faults, when they are real, are small, quick, and inexpensive to put right.